


Atmosphere 2024, 15(1), 106; https://doi.org/10.3390/atmos15010106 - 15 Jan 2024
Abstract
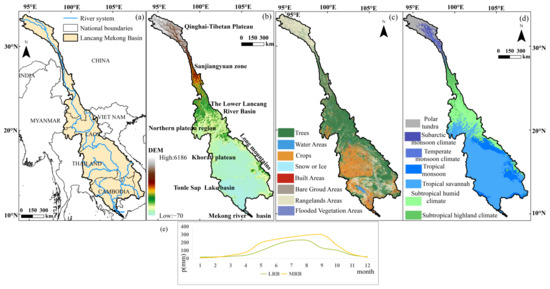
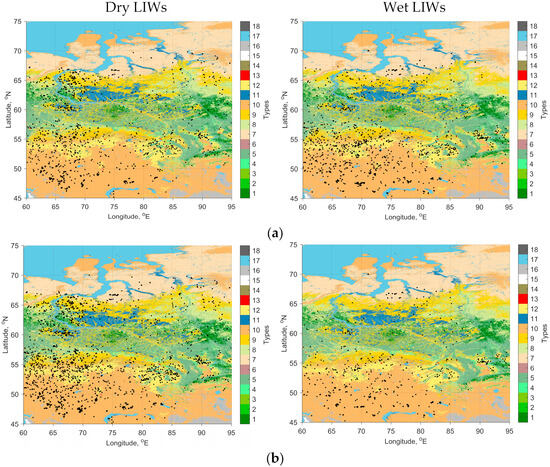
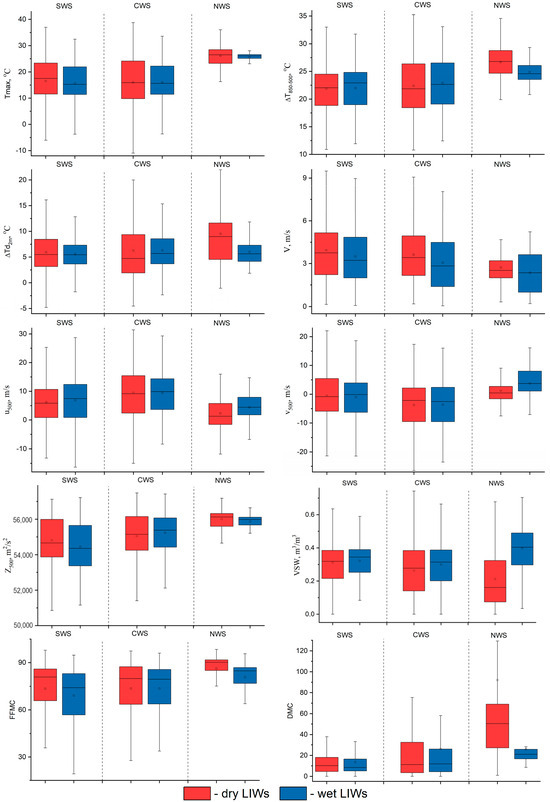
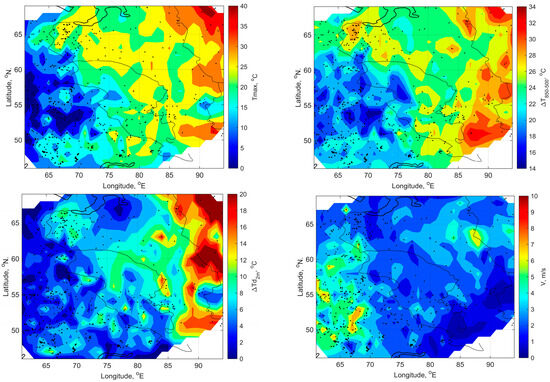
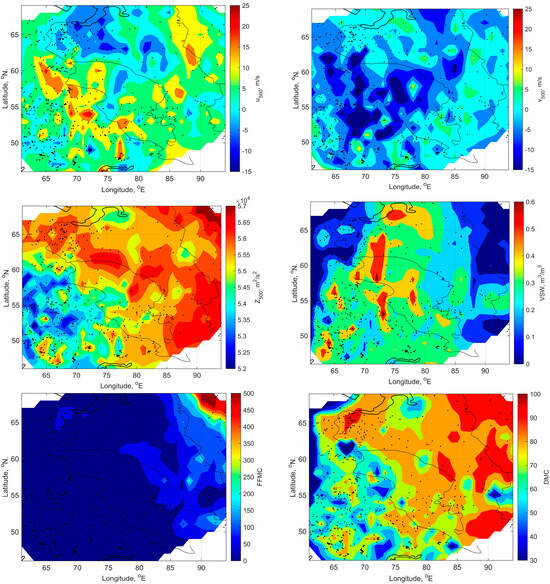
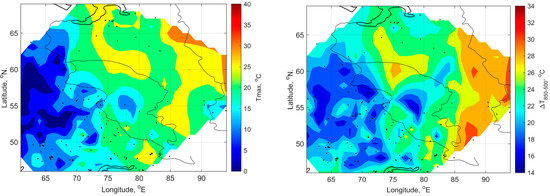
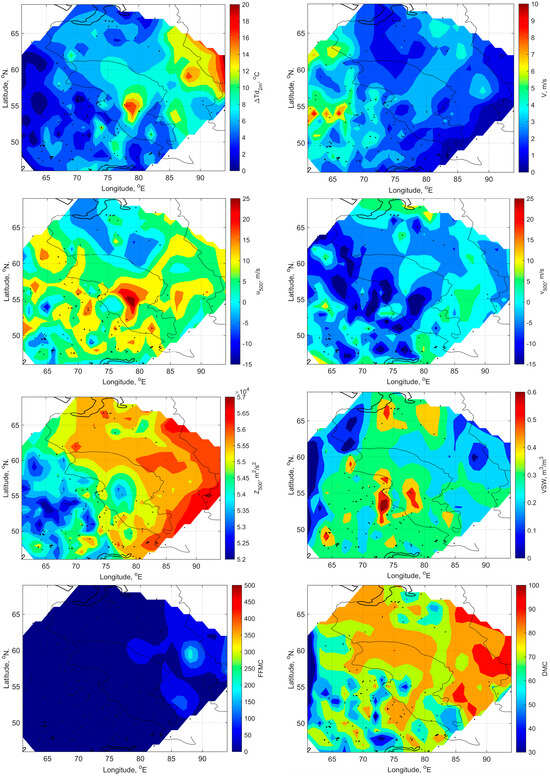
The analysis of the spatio-temporal variability of lightning-ignited wildfires and meteorological conditions preceding their occurrence from both dry lightning and lightning with precipitation in Western Siberia for the warm seasons (May–September) of 2016–2021 was carried out. In the Arctic zone, fires from lightnings
[...] Read more.
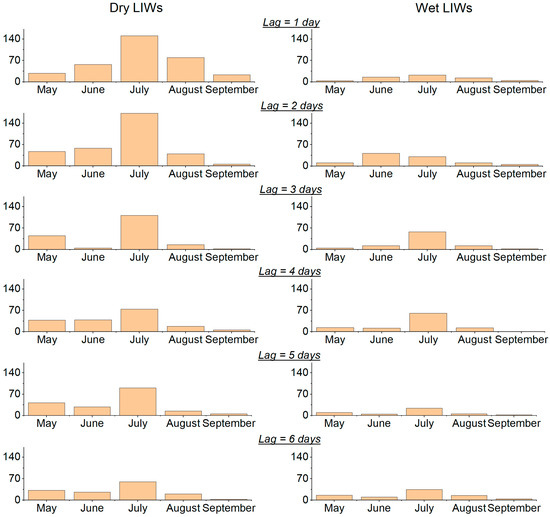
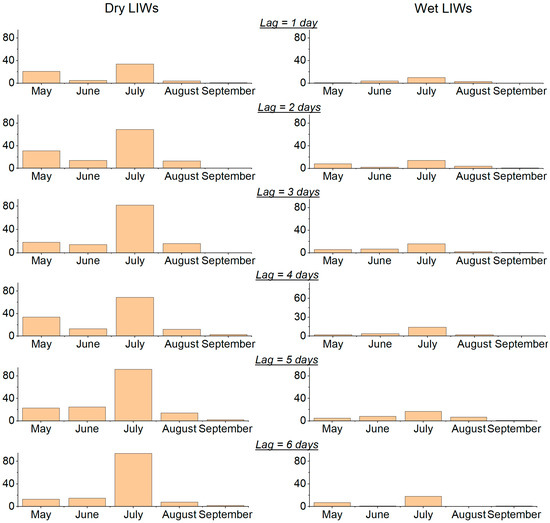
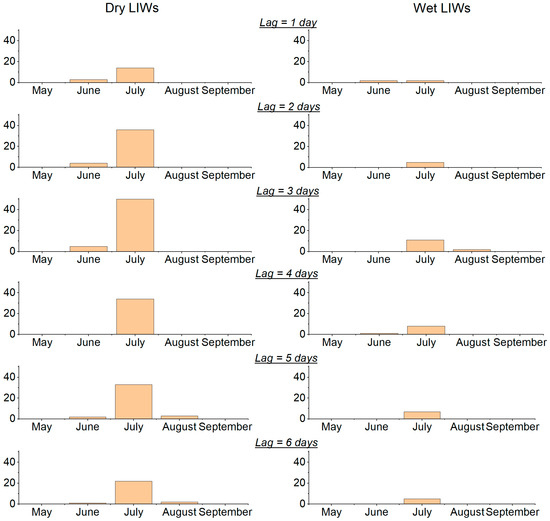
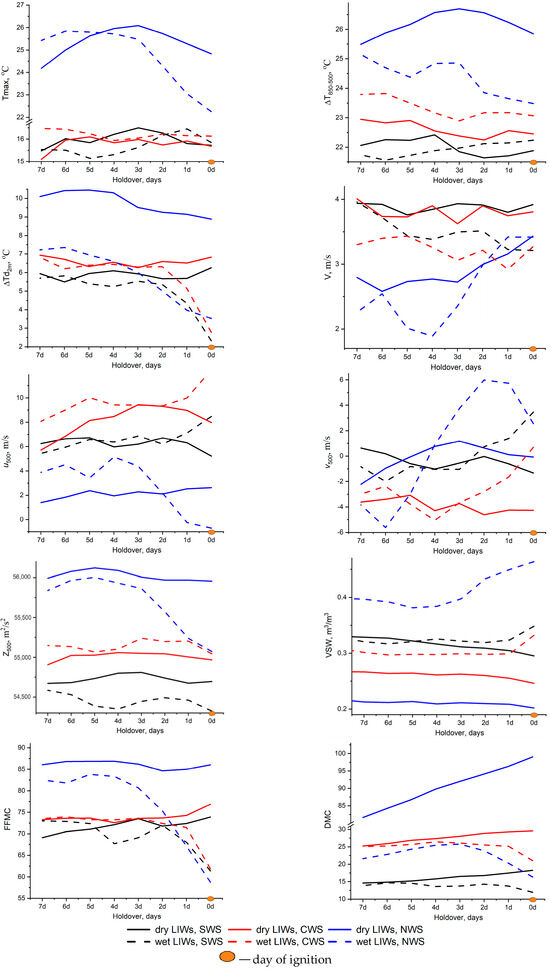
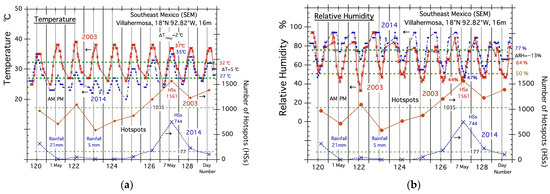
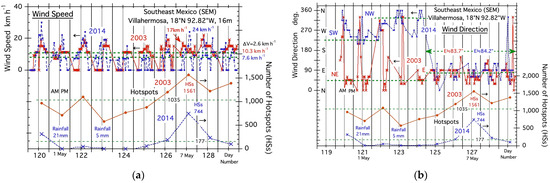
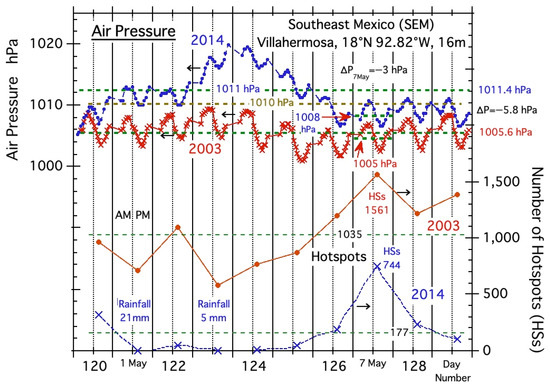
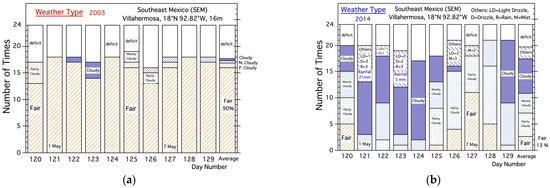
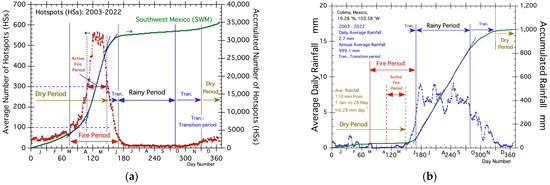
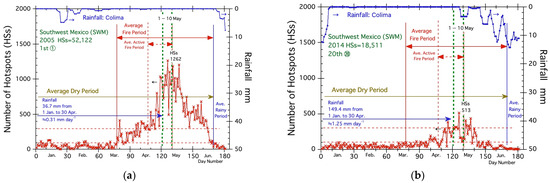
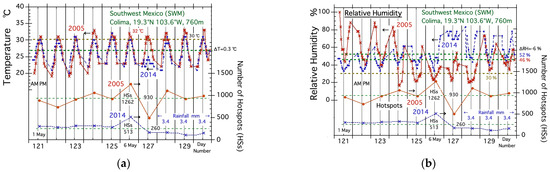
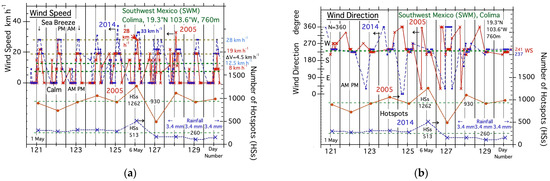
The analysis of the spatio-temporal variability of lightning-ignited wildfires and meteorological conditions preceding their occurrence from both dry lightning and lightning with precipitation in Western Siberia for the warm seasons (May–September) of 2016–2021 was carried out. In the Arctic zone, fires from lightnings occur in most cases (83%) almost without precipitation (<2.5 mm/day), whereas in the forest and steppe zones the number of cases is less (81% and 74%, respectively). The most significant changes in meteorological conditions before the ignition were also revealed in the northern part 3–4 days before. Among all considered parameters, the most important role in the occurrence of dry lightning-ignited wildfires belongs to mid-tropospheric instability, lower-tropospheric dryness, and the moisture content of the top soil and surface floor layer. Moreover, in the Arctic zone of Western Siberia, more extreme (hotter and drier) meteorological conditions should be observed for the occurrence of ignition from lightning. The threshold values for the considered meteorological parameters were derived for our region for the first time. Obtained results can be used in the development of models for potential fire hazards prediction in various landscapes, which will have a practical application in various spheres of the national economy.
Full article
(This article belongs to the Special Issue Extreme Weather Events in Siberia)
►
Show Figures
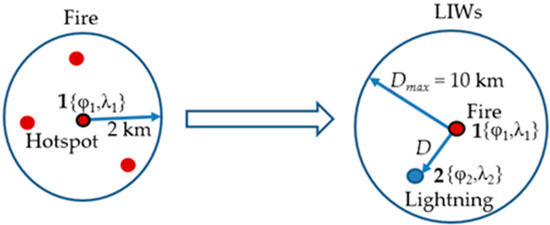
Figure 1


