


.jpg)
Econometrics 2024, 12(1), 2; https://doi.org/10.3390/econometrics12010002 - 05 Jan 2024
Abstract
►
Show Figures
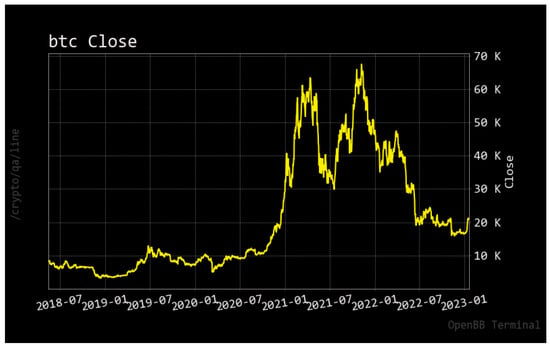
The introduction of Bitcoin as a distributed peer-to-peer digital cash in 2008 and its first recorded real transaction in 2010 served the function of a medium of exchange, transforming the financial landscape by offering a decentralized, peer-to-peer alternative to conventional monetary systems. This
[...] Read more.
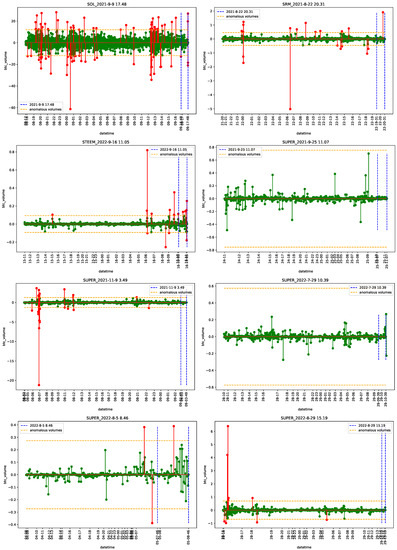
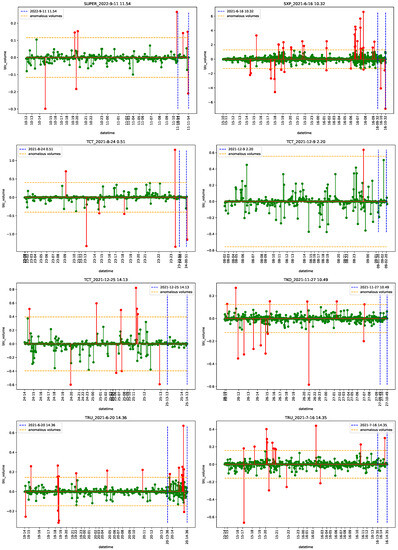
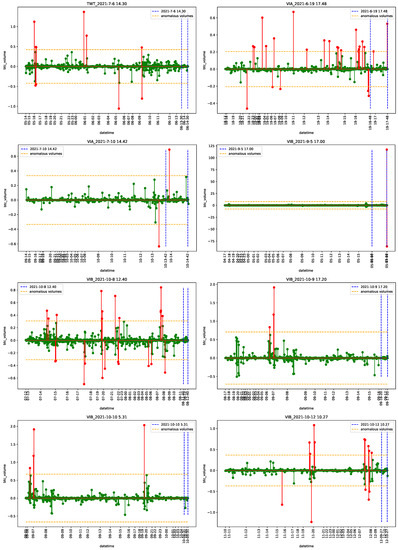
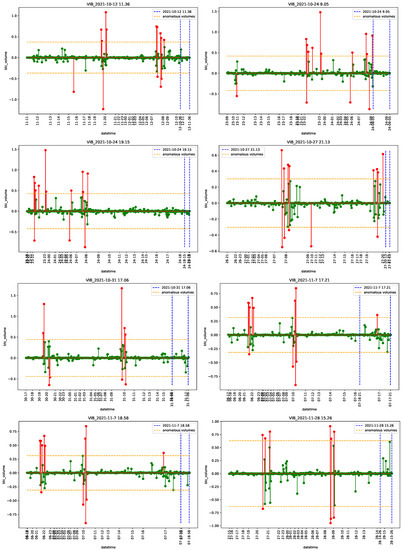
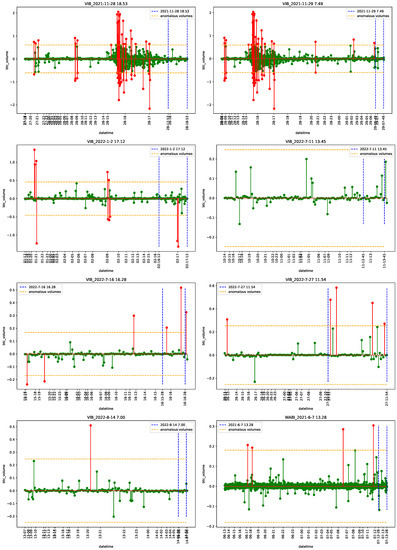
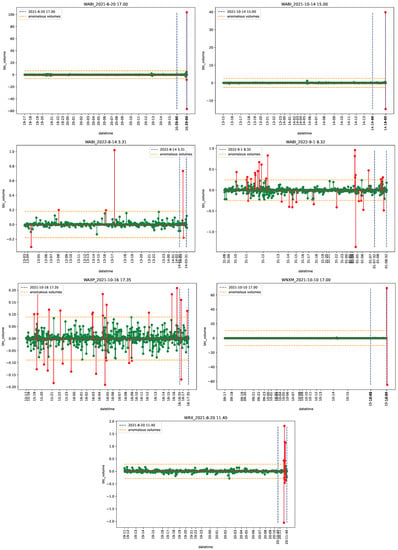
The introduction of Bitcoin as a distributed peer-to-peer digital cash in 2008 and its first recorded real transaction in 2010 served the function of a medium of exchange, transforming the financial landscape by offering a decentralized, peer-to-peer alternative to conventional monetary systems. This study investigates the intricate relationship between cryptocurrencies and monetary policy, with a particular focus on their long-term volatility dynamics. We enhance the GARCH-MIDAS (Mixed Data Sampling) through the adoption of the SB-GARCH-MIDAS (Structural Break Mixed Data Sampling) to analyze the daily returns of three prominent cryptocurrencies (Bitcoin, Binance Coin, and XRP) alongside monthly monetary policy data from the USA and South Africa with respect to potential presence of a structural break in the monetary policy, which provided us with two GARCH-MIDAS models. As of 30 June 2022, the most recent data observation for all samples are noted, although it is essential to acknowledge that the data sample time range varies due to differences in cryptocurrency data accessibility. Our research incorporates model confidence set (MCS) procedures and assesses model performance using various metrics, including AIC, BIC, MSE, and QLIKE, supplemented by comprehensive residual diagnostics. Notably, our analysis reveals that the SB-GARCH-MIDAS model outperforms others in forecasting cryptocurrency volatility. Furthermore, we uncover that, in contrast to their younger counterparts, the long-term volatility of older cryptocurrencies is sensitive to structural breaks in exogenous variables. Our study sheds light on the diversification within the cryptocurrency space, shaped by technological characteristics and temporal considerations, and provides practical insights, emphasizing the importance of incorporating monetary policy in assessing cryptocurrency volatility. The implications of our study extend to portfolio management with dynamic consideration, offering valuable insights for investors and decision-makers, which underscores the significance of considering both cryptocurrency types and the economic context of host countries.
Full article
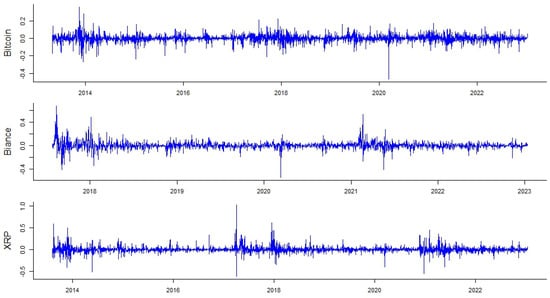
Figure 1


