


GeoHazards 2024, 5(1), 38-63; https://doi.org/10.3390/geohazards5010003 - 11 Jan 2024
Abstract
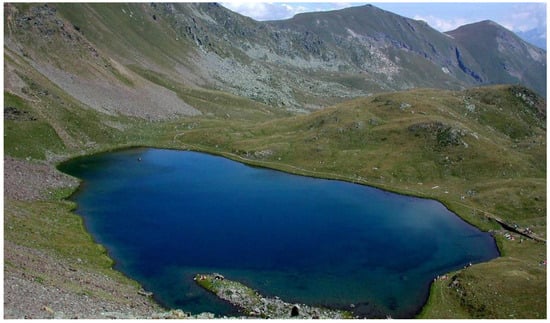
The Lac Fallère area in the upper Clusellaz Valley (tributary of the middle Aosta Valley) is shaped in micaschist and gneiss (Mont Fort Unit, Middle Penninic) and in calcschist and marble (Aouilletta Unit, Combin Zone). Lac Fallère exhibits an elongated shape and is
[...] Read more.
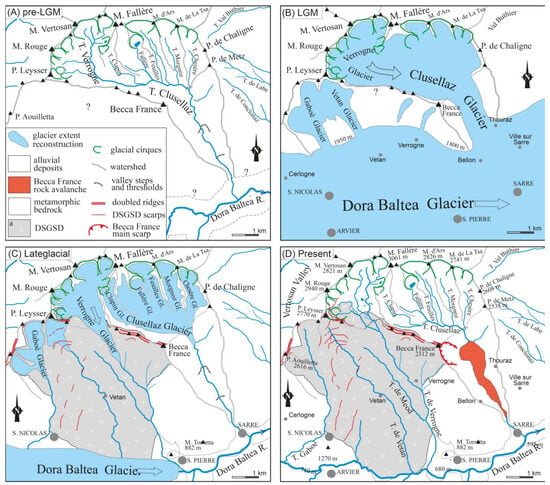
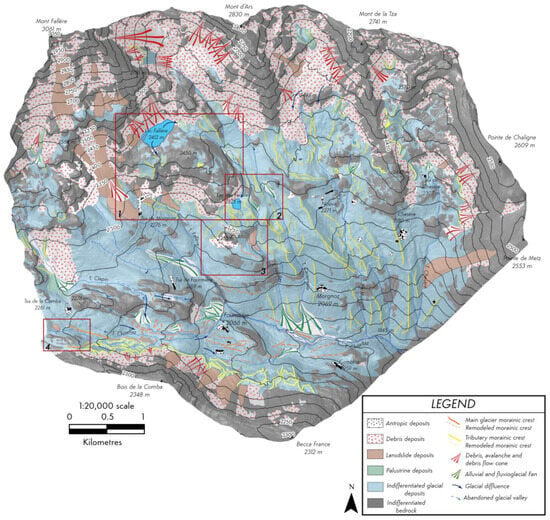
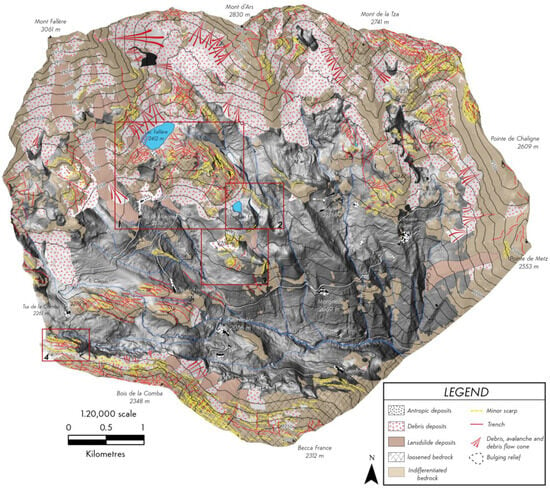
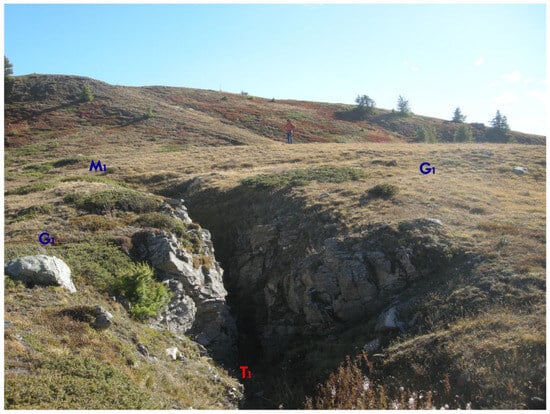
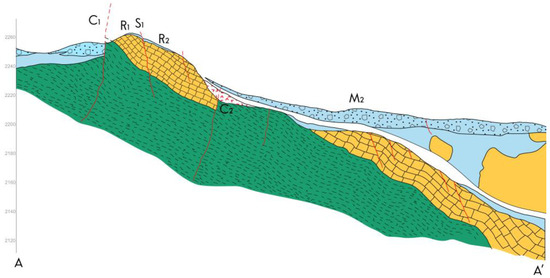
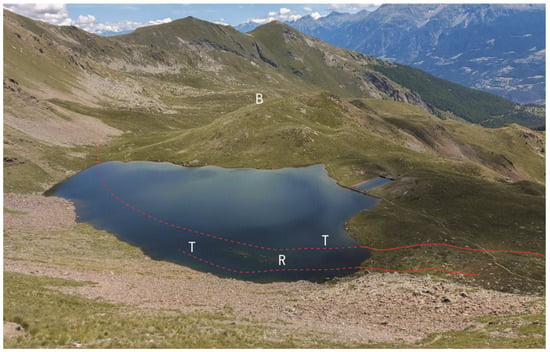
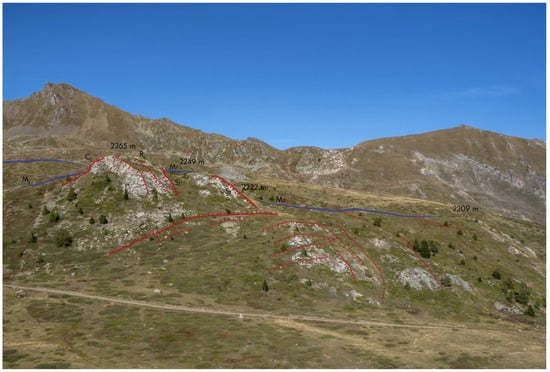
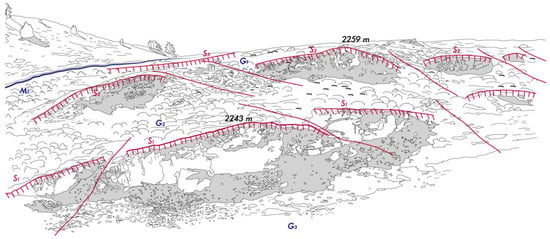
The Lac Fallère area in the upper Clusellaz Valley (tributary of the middle Aosta Valley) is shaped in micaschist and gneiss (Mont Fort Unit, Middle Penninic) and in calcschist and marble (Aouilletta Unit, Combin Zone). Lac Fallère exhibits an elongated shape and is hosted in a WSW–ENE-trending depression, according to the slope direction. This lake also shows a semi-submerged WSW–ENE rocky ridge that longitudinally divides the lake. This evidence, in addition to the extremely fractured rocks, indicates a wide, deep-seated gravitational slope deformation (DSGSD), even if this area is not yet included within the regional landslide inventory of the Aosta Valley Region. The Lac Fallère area also shows reliefs involved in glacial erosion (roches moutonnée), an extensive cover of subglacial sediments, and many moraines essentially referred to as Lateglacial. The DSGSD evolution in a glacial environment produced, as observed in other areas, effects on the facies of Quaternary sediments and the formation of a lot of wide moraines. Glacial slope sectors and lateral moraines displaced by minor scarps and counterscarps, and glaciers using trenches forming several arched moraines, suggest an interplay between glacial and gravitational processes, which share part of their evolution history.
Full article
(This article belongs to the Special Issue Geomorphological Mapping Research for Landslide)
►
Show Figures

Figure 1


