


by
, , , , , , , , , , and


Geomatics 2024, 4(1), 17-47; https://doi.org/10.3390/geomatics4010002 - 12 Jan 2024
Abstract
►
Show Figures
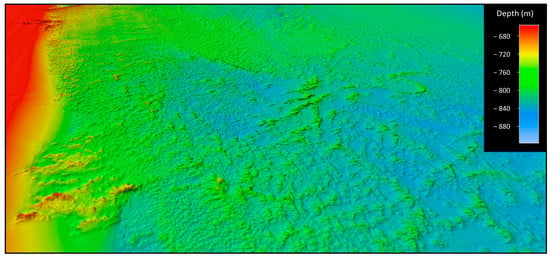
A coordinated multi-year ocean exploration campaign on the Blake Plateau offshore of the southeastern U.S. has mapped what appears to be the most expansive cold-water coral (CWC) mound province thus far discovered. Nearly continuous CWC mound features span an area up to 500
[...] Read more.
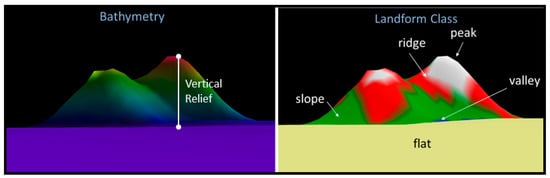
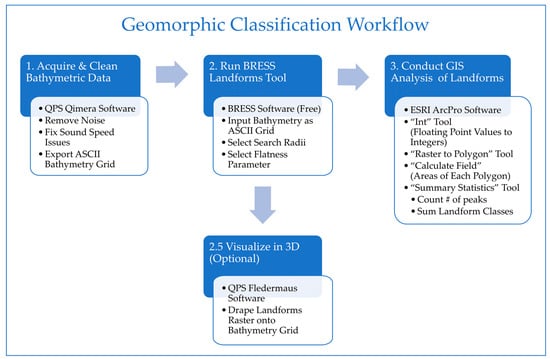
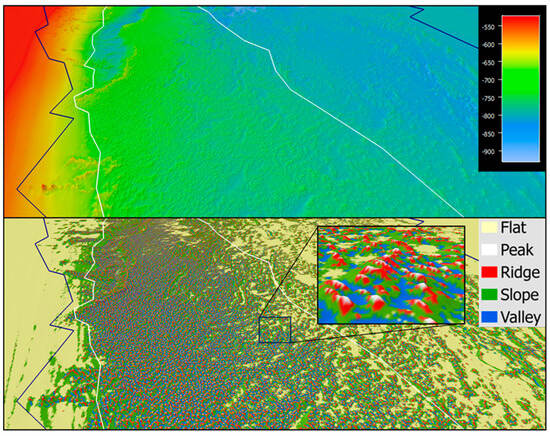
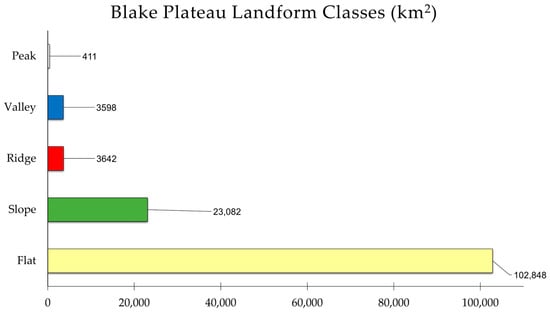
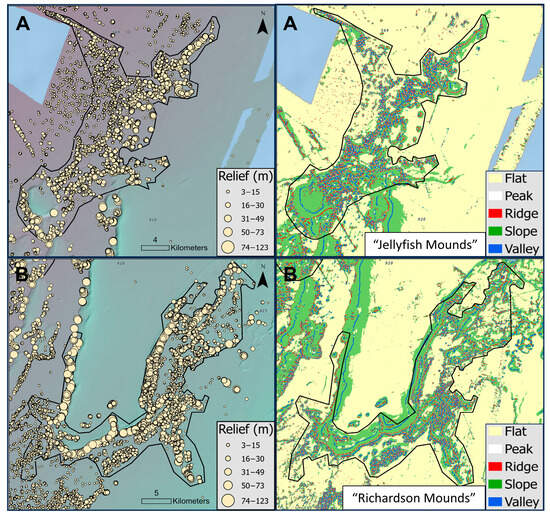
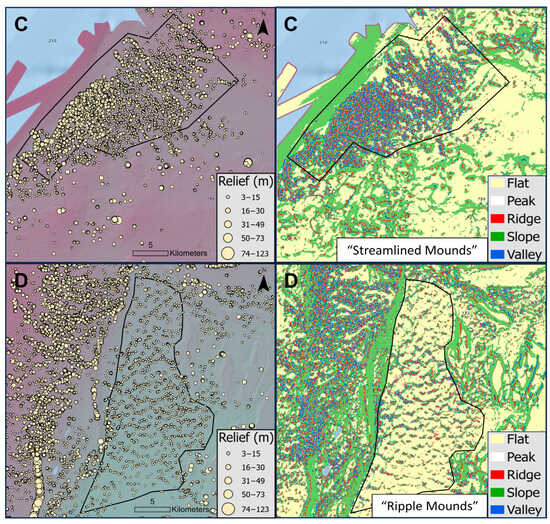
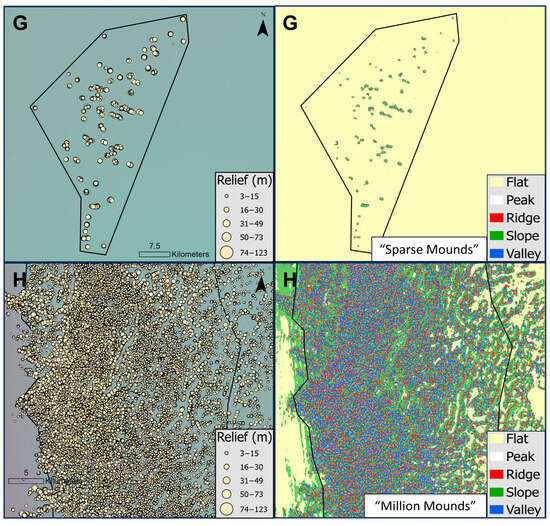
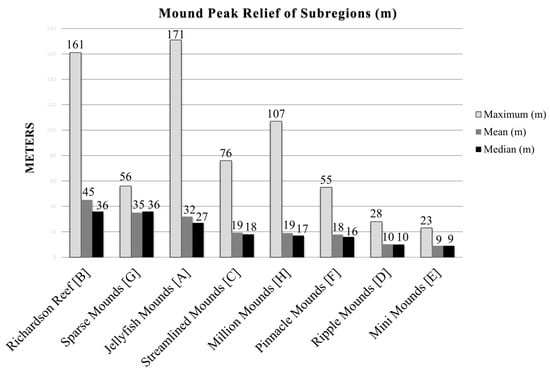
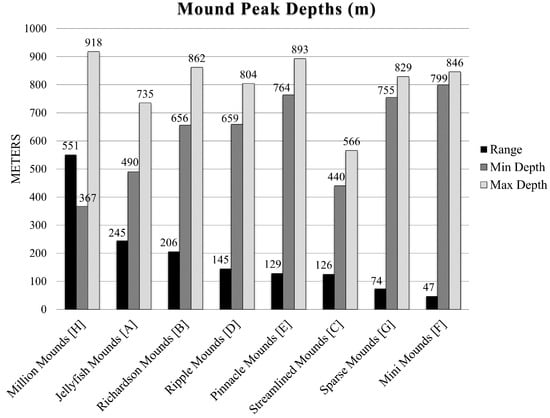
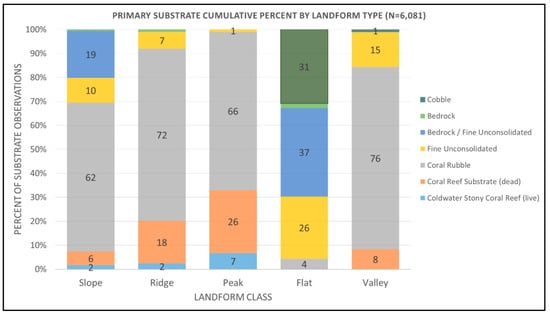
A coordinated multi-year ocean exploration campaign on the Blake Plateau offshore of the southeastern U.S. has mapped what appears to be the most expansive cold-water coral (CWC) mound province thus far discovered. Nearly continuous CWC mound features span an area up to 500 km long and 110 km wide, with a core area of high-density mounds up to 254 km long by 42 km wide. This study synthesized bathymetric data from 31 multibeam sonar mapping surveys and generated a standardized geomorphic classification of the region in order to delineate and quantify CWC mound habitats and compare mound morphologies among subregions of the coral province. Based on the multibeam bathymetry, a total of 83,908 individual peak features were delineated, providing the first estimate of the overall number of potential CWC mounds mapped in the region to date. Five geomorphic landform classes were mapped and quantified: peaks (411 km2), valleys (3598 km2), ridges (3642 km2), slopes (23,082 km2), and flats (102,848 km2). The complex geomorphology of eight subregions was described qualitatively with geomorphic “fingerprints” (spatial patterns) and quantitatively by measurements of mound density and vertical relief. This study demonstrated the value of applying an objective automated terrain segmentation and classification approach to geomorphic characterization of a highly complex CWC mound province. Manual delineation of these features in a consistent repeatable way with a comparable level of detail would not have been possible.
Full article
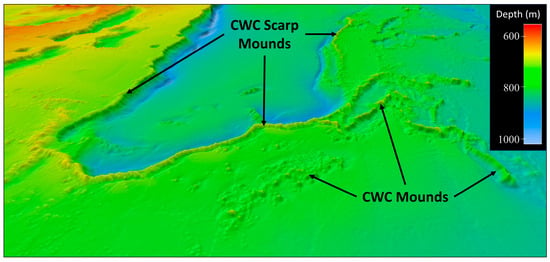
Figure 1


.JPG)
.jpg)


.jpeg)


