


by
, , , and

Hydrology 2024, 11(1), 9; https://doi.org/10.3390/hydrology11010009 - 11 Jan 2024
Abstract
Groundwater models serve the function of predicting and analyzing aquifer behavior. They require input information, such as hydrogeological parameters like hydraulic conductivity and storage coefficient, which are used to calibrate the model, and elementary actions that include recharge and extracted volumes. There are
[...] Read more.
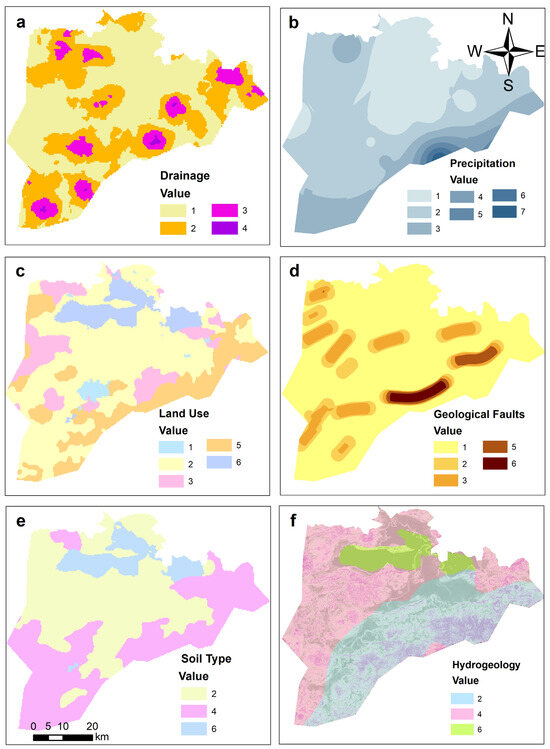
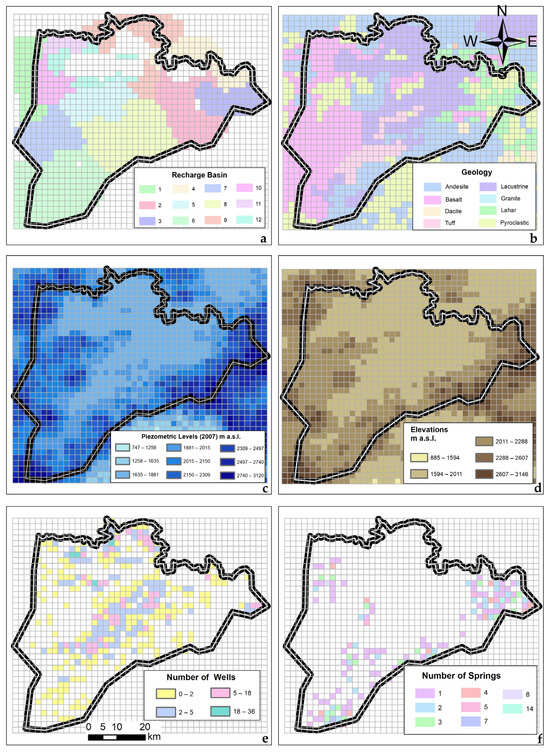
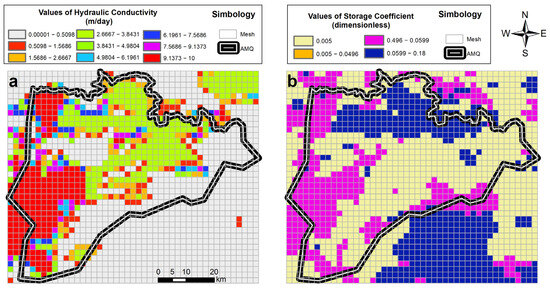
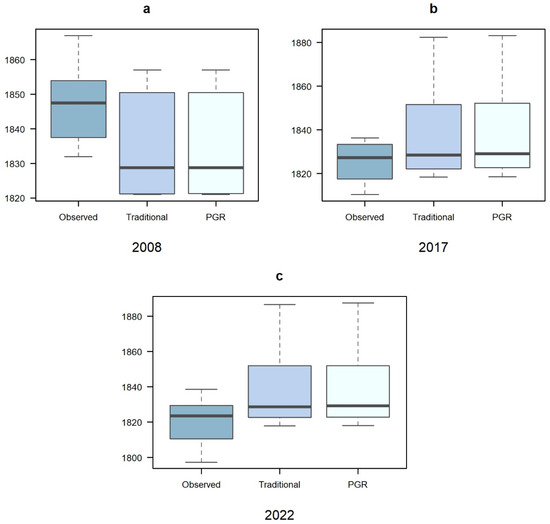
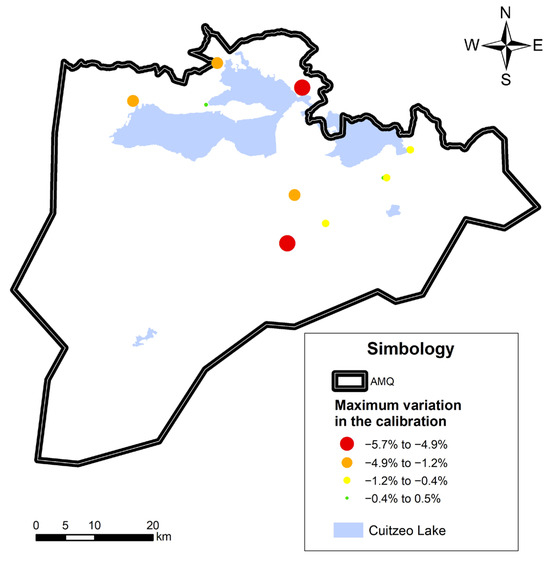
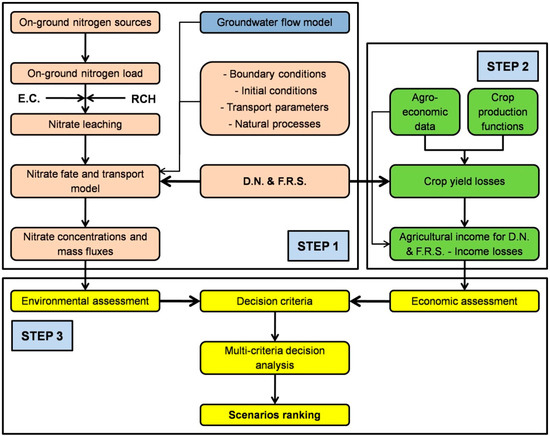
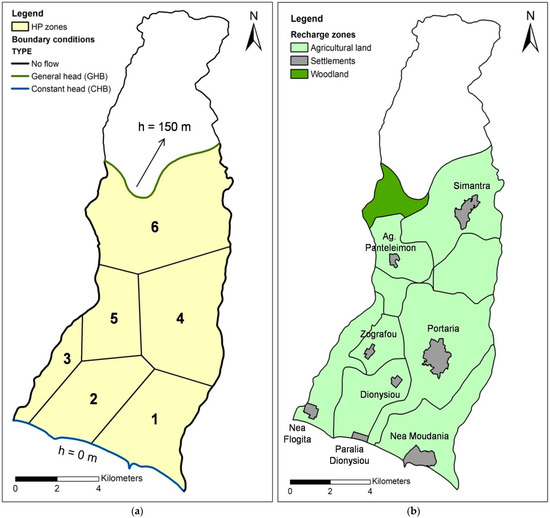
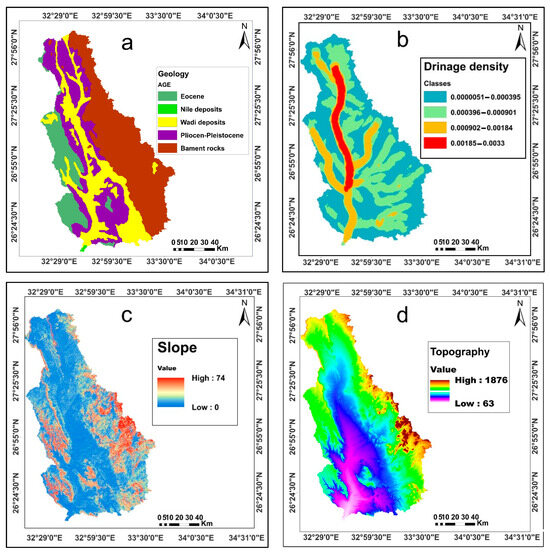
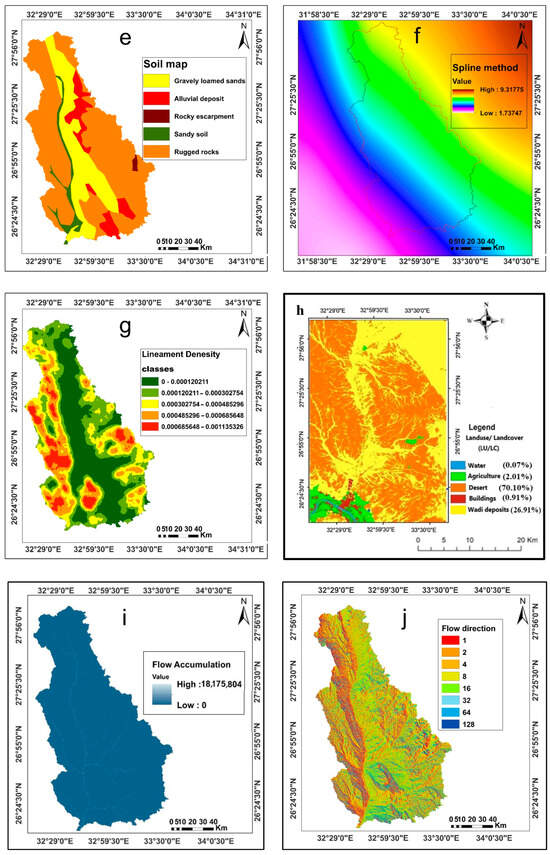
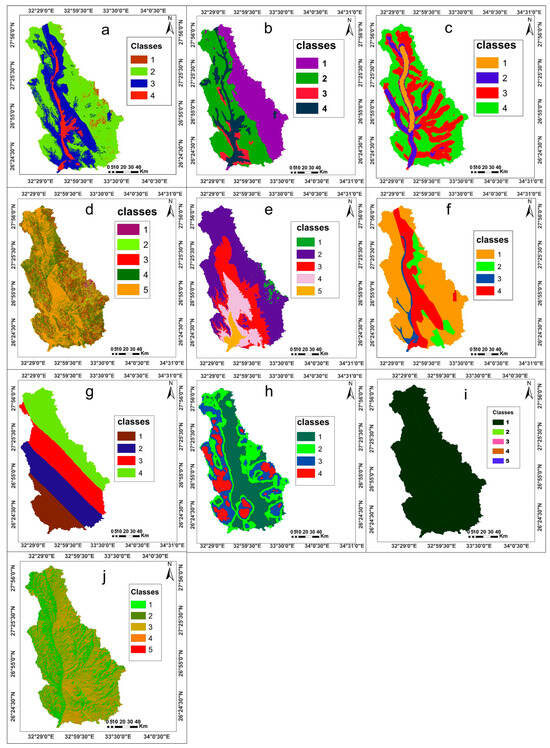
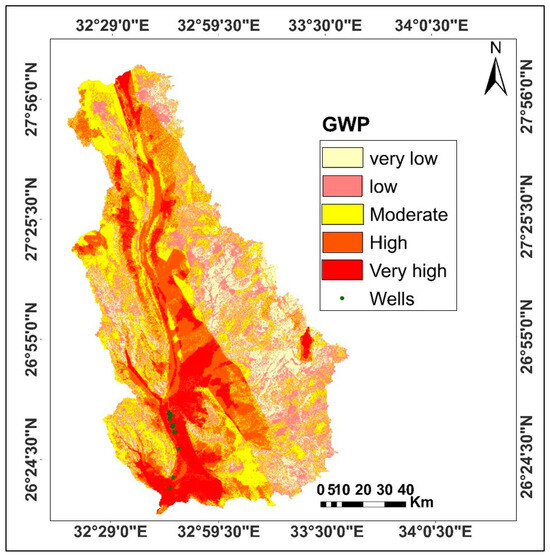
Groundwater models serve the function of predicting and analyzing aquifer behavior. They require input information, such as hydrogeological parameters like hydraulic conductivity and storage coefficient, which are used to calibrate the model, and elementary actions that include recharge and extracted volumes. There are cases in which it is insufficient to know the homogeneous recharge entering through the surface basin, referred to as traditional recharge, since, in many instances, the distribution is altered by changes in land use. For this reason, based on the geomorphological characteristics of the basin, weighting is proposed for sites with greater recharge capacity. The present work shows a solution to the recharge distribution using the potential groundwater recharge (PGR) map, which is formed by weighting spatially distributed information: (i) drainage, (ii) precipitation, (iii) land use, (iv) geological faults, (v) soil type, (vi) slope, and (vii) hydrogeology. A comparison is made between groundwater modeling using traditional recharge and PGR recharge. It is noted that the modeling perform similarly for both recharges, and the errors do not exceed 5% absolute error, which validates the model’s reliability. This manuscript demonstrates how to model and calibrate groundwater in aquifers with scarce information and variable recharge, making it reproducible.
Full article
(This article belongs to the Section Hydrological and Hydrodynamic Processes and Modelling)
►
Show Figures

Figure 1


.jpeg)


